All Activity
- Past hour
-
I'm writing this post because I've recently discovered something in the web3 space that I wanted to share with you all. There seems to be a lot happening in this space, trying to wrap all these informations in could be somewhat difficult. If there’s want thing I want to fully dive into is being a web3 creator, still learning about Artrade features. I haven't tried it out yet just came across the project on bitget exchange. but from what I've gathered, it seems to offer some intriguing features for artists like us. Fact it’s an all-in-one art platform helping creators like myself sell our work at fair prices and connect with our communities, it’s also designed for digital and traditional artists, curators, collectors and focus on content protection from crypto volatility and fostering connections within the art world. I've heard that you can even create NFT Live from your phone or connected mobile device, adding customizations like GIFs, emojis, filters, and more. It sounds like an innovative way to give your creations a unique touch Anyone had such experience? Or have a better alternative for me ?
-

official Market Update by Solidecn.com
Solid ECN ✔️ replied to Solid ECN ✔️'s topic in 📈 Forex News & Analysis
Australian Dollar's Struggle Below EMA 50 Explained Solid ECN – The Australian dollar trades at about 0.644 against the U.S. dollar as of writing, slightly below the broken support level of 0.6455. Interestingly, the AUDUSD 4-hour chart shows a doji candlestick pattern, highlighted in the image above. The Relative Strength Index still hovers below 50, but the Awesome Oscillator bars are green, giving mixed signals. Despite the contradiction between the technical indicators, the primary trend is bearish, and the pair trades below EMA 50. Based on price action analysis, our first bearish signal is the doji candlestick pattern. Therefore, from a technical standpoint, selling pressure will likely increase if the AUDUSD remains below EMA 50. Should the market shift downwards, its initial target would be this week's low of 0.6389. Conversely, EMA 50 is the dividing line between bull and bear markets. The bear market could be considered over if the price crosses and stabilizes above EMA 50. In this scenario, the uptick momentum that began this week at 0.6389 could extend to 0.652. -
 Ok! We have already contacted you via email regarding activation.
 - Today
-
 Hello, Affiliates! 💜 Welcome back to the Adepti network, where success meets opportunity! We're thrilled to unveil our best offers crafted to supercharge your Facebook advertising campaigns and boost your earnings. 💰 1117 Tajnyzralyflirt CPL CZ [DOI] EPC: $0.42 💰 94 The Local Date CPL US [DOI] EPC: $0.54 Don't miss out on these exclusive Facebook-friendly offers designed just for you! 🤑 Contact your manager today and start maximizing your profits effortlessly. Ready to take your earnings to new heights? Let's make it happen together! 💪
-
 Katerina_ODK changed their profile photo
 -
 Like to chat on Discord? So do we! Spending a few hours with friends, discussing the latest news and laughing at jokes is what we love about Discord. That's why we decided to create our own server! Here we will discuss your favorite tokens, events in the crypto world, as well as tell you about our service and its latest updates, answer your questions and help you get to better know Cryptomus! We can't wait to meet you on this new platform, chat about crypto and have a good time!
-
 Спасибо за викторину! The amount of 0.1 USD has been deposited to your account. Accounts: U42819369->U40446***. Memo: API Payment. Викторина в чате Profit-Hunters BIZ.. Date: 19:37 17.04.24. Batch: 586286159.
 -
Katerina_ODK joined the community
-
official Market Update by Solidecn.com
Solid ECN ✔️ replied to Solid ECN ✔️'s topic in 📈 Forex News & Analysis
GBPUSD Sideways Movement: Bearish Signals Despite Consolidation Solid ECN—The GBPUSD currency pair trades sideways between 1.249 and 1.240. The Bollinger Bands are squeezed and demonstrate the range area on the 4-hour chart. Other technical indicators, except Standard Deviation, signal and promise a bullish trend while the uptick momentum is weak, and we don't see strength from the buyers. From a technical standpoint, the primary trend is bearish while the pair hovers below EMA 50 and the Ichimoku cloud. However, the current consolidation phase might test the EMA 50 again in today's trading session, potentially forming a double-top pattern on the 4-hour chart. Consequently, a failure to stabilize the price above 1.2499 will likely lead to a decline, and initially, the pair would test this week's low at 1.240 support. -
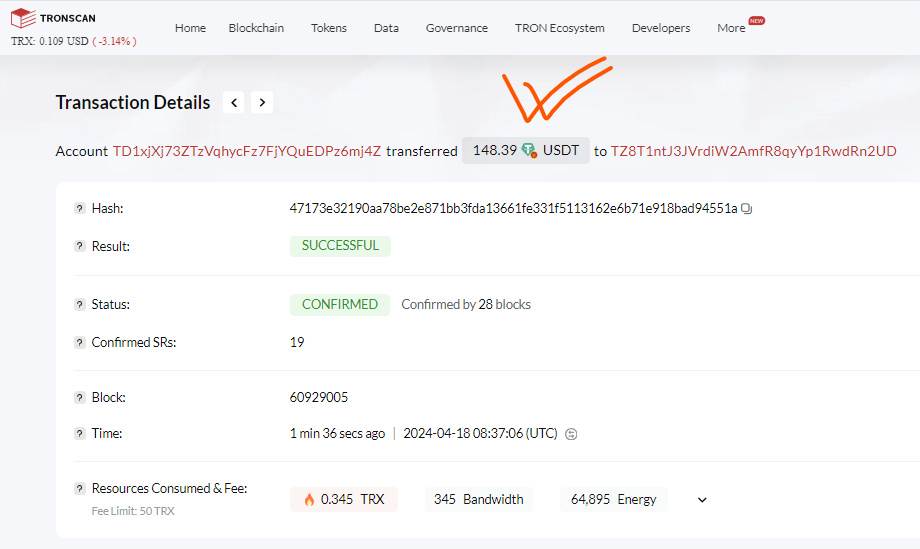
 $148.39 Usdt Trc20 Fully Instantly gotten from miner30minute.cloud Hash - 47173e32190aa78be2e871bb3fda13661fe331f5113162e6b71e918bad94551a Proof - https://tronscan.org/#/transaction/47173e32190aa78be2e871bb3fda13661fe331f5113162e6b71e918bad94551a
-

HFMarkets (hfm.com): Market analysis services.
HFM replied to HFM's topic in 📈 Forex News & Analysis
Date: 18th April 2024. Market News – Stock markets benefit from Dollar correction. Economic Indicators & Central Banks: Technical buying, bargain hunting, and risk aversion helped Treasuries rally and unwind recent losses. Yields dropped from the recent 2024 highs. Asian stock markets strengthened, as the US Dollar corrected in the wake of comments from Japan’s currency chief Masato Kanda, who said G7 countries continue to stress that excessive swings and disorderly moves in the foreign exchange market were harmful for economies. US Stockpiles expanded to 10-month high. The data overshadowed the impact of geopolitical tensions in the Middle East as traders await Israel’s response to Iran’s unprecedented recent attack. President Joe Biden called for higher tariffs on imports of Chinese steel and aluminum. Financial Markets Performance: The USDIndex stumbled, falling to 105.66 at the end of the day from the intraday high of 106.48. It lost ground against most of its G10 peers. There wasn’t much on the calendar to provide new direction. USDJPY lows retesting the 154 bottom! NOT an intervention yet. BoJ/MoF USDJPY intervention happens when there is more than 100+ pip move in seconds, not 50 pips. USOIL slumped by 3% near $82, as US crude inventories rose by 2.7 million barrels last week, hitting the highest level since last June, while gauges of fuel demand declined. Gold strengthened as the dollar weakened and bullion is trading at $2378.44 per ounce. Market Trends: Wall Street closed in the red after opening with small corrective gains. The NASDAQ underperformed, slumping -1.15%, with the S&P500 -0.58% lower, while the Dow lost -0.12. The Nikkei closed 0.2% higher, the Hang Seng gained more than 1. European and US futures are finding buyers. A gauge of global chip stocks and AI bellwether Nvidia Corp. have both fallen into a technical correction. The TMSC reported its first profit rise in a year, after strong AI demand revived growth at the world’s biggest contract chipmaker. The main chipmaker to Apple Inc. and Nvidia Corp. recorded a 9% rise in net income, beating estimates. Always trade with strict risk management. Your capital is the single most important aspect of your trading business. Please note that times displayed based on local time zone and are from time of writing this report. Click HERE to access the full HFM Economic calendar. Want to learn to trade and analyse the markets? Join our webinars and get analysis and trading ideas combined with better understanding on how markets work. Click HERE to register for FREE! Click HERE to READ more Market news. Andria Pichidi Market Analyst HFMarkets Disclaimer: This material is provided as a general marketing communication for information purposes only and does not constitute an independent investment research. Nothing in this communication contains, or should be considered as containing, an investment advice or an investment recommendation or a solicitation for the purpose of buying or selling of any financial instrument. All information provided is gathered from reputable sources and any information containing an indication of past performance is not a guarantee or reliable indicator of future performance. Users acknowledge that any investment in FX and CFDs products is characterized by a certain degree of uncertainty and that any investment of this nature involves a high level of risk for which the users are solely responsible and liable. We assume no liability for any loss arising from any investment made based on the information provided in this communication. This communication must not be reproduced or further distributed without our prior written permission. -

Market Technical Analysis by RoboForex
RBFX Support replied to RBFX Support's topic in 📈 Forex News & Analysis
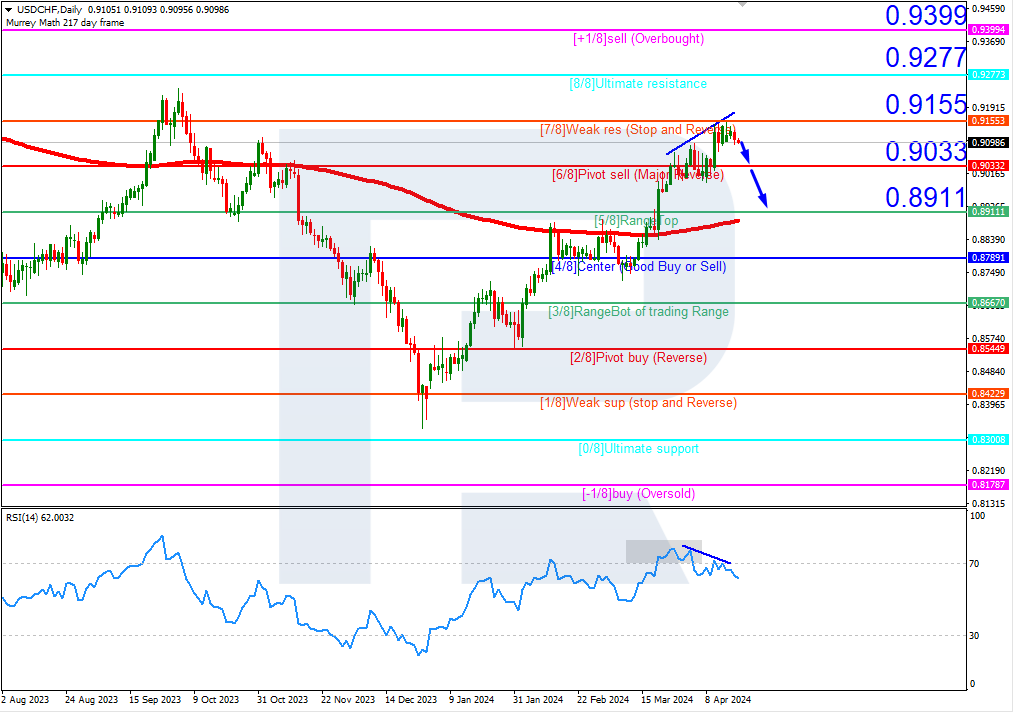
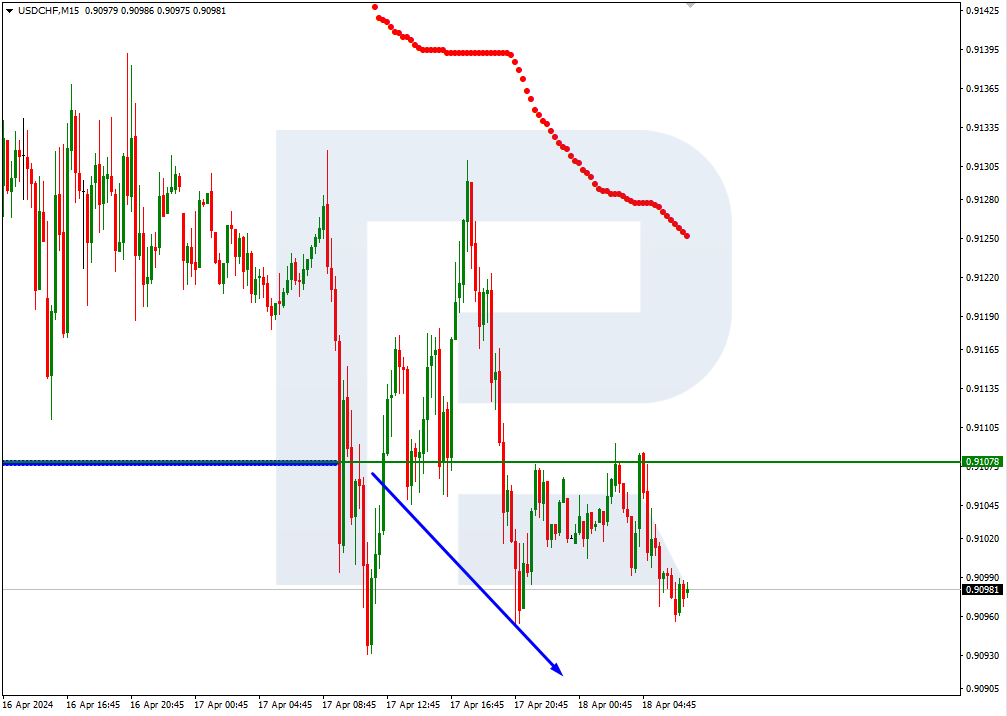
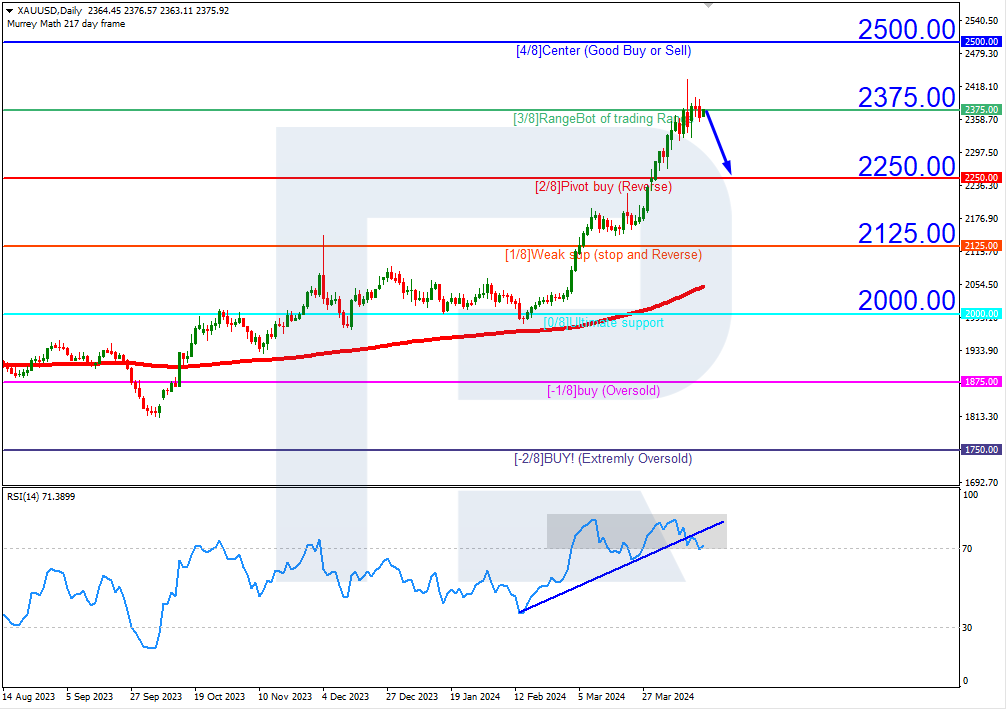
Murrey Math Lines 18.04.2024 (USDCHF, XAUUSD) USDCHF, “US Dollar vs Swiss Franc” USDCHF quotes are above the 200-day Moving Average on D1, indicating the prevalence of an uptrend. However, a divergence has formed on the RSI. As a result, in this situation, a test of the 6/8 (0.9033) level is expected, followed by a breakout and a price decline to the support at 5/8 (0.8911). This decline could be interpreted as a correction of an uptrend. The scenario might be cancelled by a breakout of the resistance at 7/8 (0.9155). In this case, the pair could rise to the 8/8 (0.9277) level. On M15, the lower boundary of the VoltyChannel is broken, which increases the probability of a further price decline. XAUUSD, “Gold vs US Dollar” Gold quotes are above the 200-day Moving Average on D1, indicating the prevalence of an uptrend. However, the RSI is in the overbought area. In this situation, a rebound from 3/8 (2375.00) is expected, followed by a price decline to the support at 2/8 (2250.00). This movement could be interpreted as a correction of an uptrend. The scenario might be cancelled by rising above 3/8 (2375.00), in which case, the quotes could grow to the resistance at 4/8 (2500.00). Read more - Murrey Math Lines (USDCHF, XAUUSD) Attention! Forecasts presented in this section only reflect the author’s private opinion and should not be considered as guidance for trading. RoboForex bears no responsibility for trading results based on trading recommendations described in these analytical reviews. Sincerely, The RoboForex Team
-
Market Fundamental Analysis by RoboForex
RBFX Support replied to RBFX Support's topic in 📈 Forex News & Analysis
EUR is recovering. Overview for 18.04.2024 The primary currency pair is rebounding on Thursday. The current EURUSD exchange rate stands at 1.0674. The US dollar lost some strength as the market grew tired of worrying about shifting expectations of interest rate cuts from the Federal Reserve. Investors already know that the Federal Reserve's current monetary policy settings will remain restrictive for some time. It is high time the EURUSD normalised. The US dollar has recently surged as the released macroeconomic statistics confirmed the robust performance of the US economy, reducing the likelihood of an interest rate reduction in June. Additionally, the US dollar has been in demand as a safe-haven asset while the Middle East is experiencing heightened tensions. Risk appetite is now recovering, and this is becoming more evident with the agreement among the US, Japan, and South Korea to consult on currency market issues. Today, the market awaits weekly data on jobless claims in the US and the March report on existing home sales. Fundamental analysis for other instruments can be found in the section "Forex Forecasts and Analysis" on our website. Attention! Forecasts presented in this section only reflect the author’s private opinion and should not be considered as guidance for trading. RoboForex bears no responsibility for trading results based on trading recommendations described in these analytical reviews. Sincerely, The RoboForex Team -
 The amount of 0.3 USD has been deposited to your account. Accounts: U4269->U2302. Memo: API Payment. Викторина в чате Profit-Hunters BIZ.. Date: 19:37 17.04.24. Batch: 586286029.
 -
UK100 Share Index Rises as UK Inflation Slows Yesterday, the UK Office for National Statistics (ONS) reported that the CPI stood at 3.2% in March. According to ForexFactory, analysts expected 3.1%, and a month ago the index was 3.4%. Grant Fitzner, chief economist at the ONS, said: “Once again, food prices were the main reason for the fall, with prices rising by less than we saw a year ago. Similarly to last month, we saw a partial offset from rising fuel prices.” Thus, actual inflation in the UK fell to its lowest level in two and a half years. According to Yahoo Finance, this weakening of inflation could influence the Bank of England to start cutting interest rates from the current level of 5.25% in June. In anticipation of an easing of monetary policy, the values of the UK stock index UK100 increased yesterday. Today it is above the 7,900 level. TO VIEW THE FULL ANALYSIS, VISIT FXOPEN BLOG Disclaimer: This article represents the opinion of the FXOpen INT company only. It is not to be construed as an offer, solicitation, or recommendation with respect to products and services provided by the the FXOpen INT, nor is it to be considered financial advice.
-
 17.04.24 19:37 Получать Поступил платеж 0,1 USD со счета U42819369 на счет U36512265. Пакет: 586286267. Памятка: Оплата через API. Викторина в чате Profit-Hunters BIZ Спасибо 😊
 -
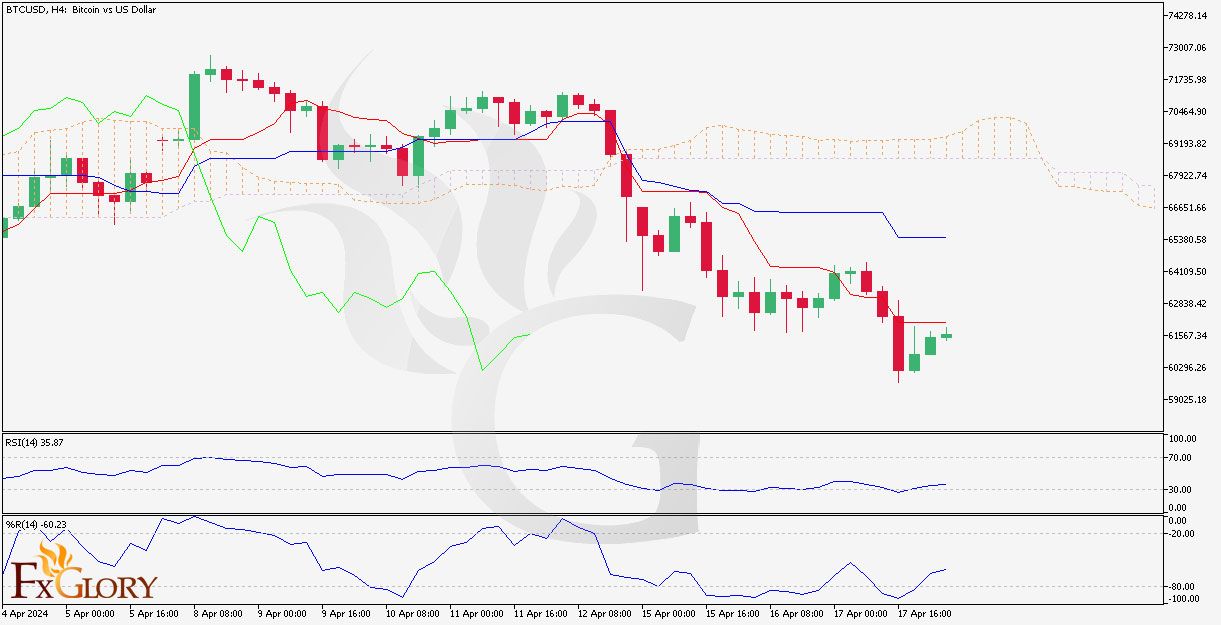
BTCUSD analysis for 18.04.2024 Time Zone: GMT +2 Time Frame: 4 Hours (H4) Fundamental Analysis: Bitcoin's valuation against the US Dollar is greatly influenced by a mix of market sentiment, technological developments, regulatory news, and macroeconomic trends. Global economic uncertainties and inflation rates are fundamental factors that can drive investors toward Bitcoin as a potential hedge. Additionally, changes in regulatory stances in key markets, such as recent legislation or enforcement actions, can significantly impact Bitcoin's price. The growing interest in decentralized finance (DeFi) and institutional investment in cryptocurrency also contribute to BTCUSD dynamics. Price Action: The H4 timeframe for BTCUSD shows a downtrend with the price moving below the Ichimoku cloud and key moving averages. The market has been forming lower highs and lower lows, which is indicative of a bearish sentiment in the short to medium term. There has been a slight recovery in the most recent price action, but the market remains under bearish pressure. Key Technical Indicators: Williams %R: The Williams Percentage is currently indicating oversold conditions, which could hint at a potential short-term reversal if buyers step in. RSI (Relative Strength Index): The RSI is below the 50 threshold, which typically suggests bearish momentum, although it is not in the oversold territory, leaving room for potential downward movement. Ichimoku Cloud: Price is trading below the Ichimoku cloud, indicating that the path of least resistance is to the downside and confirming the current bearish trend. Support and Resistance: Support: The nearest support is found at the recent low around $59,025, with a more substantial support zone near $58,000. Resistance: Immediate resistance can be seen near the lower boundary of the Ichimoku cloud, followed by a stronger resistance at the $62,388 level, which aligns with the cloud's upper boundary. Conclusion and Consideration: The BTCUSD pair on the H4 chart is exhibiting bearish tendencies with the price action and technical indicators suggesting a continuation of the downtrend. The market could be ripe for a short-term bounce due to the oversold Williams %R indicator, but the overarching trend remains downward. It’s critical for traders to keep an eye on global economic indicators and crypto-specific news, which could abruptly influence the market. Implementing robust risk management strategies is vital, particularly given Bitcoin’s historical volatility. Disclaimer: The provided analysis is for informational purposes only and does not constitute investment advice. Traders should conduct their own research and analysis before making any trading decisions. FxGlory 18.04.2024
-
the concept of leverage.. Leverage or financial leverage is basically an investment where borrowed money or debt is used to maximise the returns of an investment, acquire additional assets or raise funds for the company..
-
 joky11 joined the community
 -
 The amount of 0.1 USD has been deposited to your account. Accounts: U42819369-U2976. Memo: API Payment. Викторина в чате Profit-Hunters Date: 19:37 17.04.24. Batch: 586286274.
 -
 The amount of 0.1 USD has been deposited to your account. Accounts: U428*->U198* Memo: API Payment. Викторина в чате Profit-Hunters BIZ.. Date: 19:37 17.04.24. Batch: 586286220 Cпасибо
 -
 Спасибо за бонус The amount of 0.1 USD has been deposited to your account. Accounts: U428->U256. Memo: API Payment. Викторина в чате Profit-Hunters BIZ.. Date: 18:37 16.04.24. Batch: 586027850.
 -

360Proxy.com - Proxy Provider
BBBill replied to BBBill's topic in 🛠️ Affiliate Marketing Tools & Resources
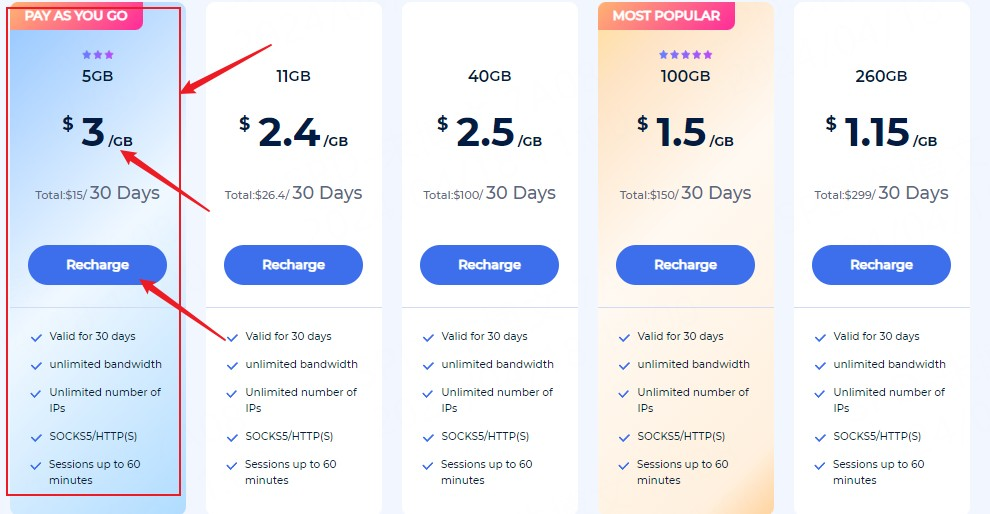
360Proxy has updated its dedicated test package! https://www.360proxy.com/register.html?utm-keyword=?Proxy ●$3/GB, buy 5GB for as low as $15. ●Supports multiple network protocols, including but not limited to SOCKS5/HTTP(S). ●Covering 190+ locations around the world, 80 million+ IP ●Target any country/city/zip code/ISP ●Acquire proxy through username and password authentication ✅Usage scenarios: web crawling,e-commerce,market research,advertising verification,social media,etc.
-

Risk factors in trading
uncle gober replied to Matheus Schotsman's topic in 💸 Forex Discussions & Help
The risks in forex trading are indeed very high, but they are also balanced by the potentially significant profits. That's why it's important to pay attention to risk management, so that we can gain a better understanding and trade to the fullest potential with Tickmill. -
I myself feel comfortable with long-term trading. With a long-term approach, I can stay calm and prepare everything thoroughly. This way, trading can be profitable alongside Tickmill broker.
-
select your trading strategy
uncle gober replied to Noah Jackson's topic in 💸 Forex Discussions & Help
Learning is indeed crucial in forex trading. Therefore, as traders, it's important to engage in regular learning sessions to gain understanding and, of course, to be better prepared for trading on real accounts with Tickmill broker. -
Knowledge is extremely crucial in forex trading. That's why it's essential to continuously develop one's knowledge and understanding. This way, as we progress, our trading decisions can become wiser alongside Tickmill broker.
-
What are some reasons to start your own business?
uncle gober replied to Ronald Ray's topic in 💸 Forex Discussions & Help
Indeed, there are numerous brokers available in the forex market, and it's up to the trader to choose the one that suits them best. By making the right choice of broker, trading can proceed comfortably and safely alongside Tickmill broker.